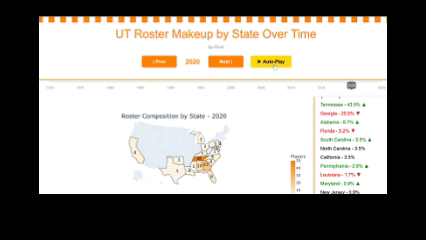
I made a web app (built with Python and Dash, hosted on Render) that shows the Vols roster makeup by state for every season going back to 1970. You can scroll through each year and see how the roster changed over time. The map updates and there's a legend that shows the percentage of the roster from each state.
The percentages compare each state to the previous year so you can see which ones are gaining or losing ground. There's an autoplay option too if you want to just sit back and watch it change year by year.
It works on mobile but it looks better on desktop. I'm not a frontend dev or anything and this is just a side project I put together for fun. Let me know what you think.
I should add that I built this using publicly available roster data acquired from utsports.com.
Website might take 20s or so to spin up if you're the first person to look at it in a while.
Link: UT Football Roster Map


