
AlwaysOrangeNeverBlue
Well-Known Member
- Joined
- Aug 7, 2019
- Messages
- 224
- Likes
- 507
Got bored this morning and got a little inspiration from a RockyTopInsider article detailing some of the changes in offensive output from schools the year prior to Chaney's arrival and during his first year there. I took some of the data they compiled and extrapolated on it further to give an outlook/projection on what the offense this year will look like, at least from a statistics perspective. Skip to the Chart below for those who don't care about the methodology or want to get to that after.
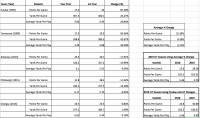
2019 UT Season Projected Offensive Numbers based on Chaney's Average % Change
Calculated the percentage change in each school's Prior Year and 1st Year's: (1) Points Per Game; (2) Yards Per Game; and (3) Average Yards Per Play. You'll be able to see each stop's statistics below. I then calculated the average % change, and then used that mean to calculate a hypothetical "average" increase that could be expected to be seen this year for the Vols. This was a purely quantitative analysis.
2019 UT Season Projected Offensive Numbers based on Chaney's Purdue and UT % Changes
Their point at the end adds a good qualitative twist to it, which suggests that the Purdue and UT seasons are a greater indicator. This is due to those two seasons being ones in which Chaney took over with an incumbent QB, unlike others where he had to implement a new, unexperienced one. These numbers were a hybrid of quantitative and qualitative analysis.
The RockyTopInsider Article link is here: How Big of an Impact Can Jim Chaney Have in 2019? | Rocky Top Insider
Conclusion
Both of these are good indicators of where UT's offense should be this year. Personally, I think it will be somewhere in between the two, with the YPG of the Purdue/UT chart more indicative (although still too high) for that statistic and the PPG and AYPP of the Overall Average chart being more indicative for that statistic.
Enjoy!
Attachments
Last edited:

