2018 vs 2019 Vols: statistical breakdown

#1

kamoshika

Well-Known Member
Joined
Jun 20, 2008
Messages
4,272
Likes
20,093
#1
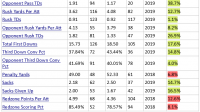
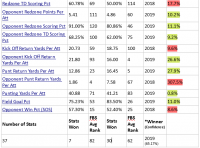
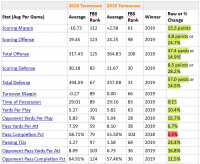
More stats than you can shake a stick at! Bottom line, we're obviously a better team this year beyond our winning record, showing moderate-to-significant improvement in most key areas. Most improved this year: overall pass defense and scoring defense. Most important performance decline, IMO: red zone scoring.

Year-over-year improvement highlighted in green
Year-over-year decline highlighted in red
1575217675451.png
1575217820073.png
1575217885374.png
Source: MyTeamsBetter - College Football Team Comparison
 
Last edited:
#2
#2
So, we can be 65% confident that we actually improved over last season? Sounds about right.
 
#3
#3
Each one of the stats is given the same weight-this is fake math. Yards/Attempt up 6.7%, with out the total number of attempts from both years, it means zero. (completion down 5.5%-), or penalty yards is given the same weight as rushing TDs? I don't see it. To say we are 65% better than last season (as a team) based on this calculation(s), is bogus. We may be 65% better, or 87.3% better, you could manipulate these stats any way you'd like to get the number you'd like. I'll stick with the old fashion, tried and true, W&L record.
 
  • Like
Reactions: TrumpedUpVol
#4
#4
Improvement in most areas, decline in some others. If nothing else, it just tells me we are headed in the right direction. I never would have thought this team would finish the regular season 7-5 after the first 2 games. Taking advantage of the extra bowl practices and closing the recruiting class strong are imperative for future success.
 
#5
#5
Each one of the stats is given the same weight-this is fake math. Yards/Attempt up 6.7%, with out the total number of attempts from both years, it means zero. (completion down 5.5%-), or penalty yards is given the same weight as rushing TDs? I don't see it. To say we are 65% better than last season (as a team) based on this calculation(s), is bogus. We may be 65% better, or 87.3% better, you could manipulate these stats any way you'd like to get the number you'd like. I'll stick with the old fashion, tried and true, W&L record.

That site's win-confidence methodology is based on this formula: (Stats Won % + FBS Avg Rank % + Win %) x Opponent Win %. Agree that it's a flawed approach to assign each of these stats equal weight, just as it's flawed to claim that passing yards per attempt means zero. But the stats provided are actual, factual numbers that illustrate the overall improvement we've seen this year, which led to our better record and was the whole point of this exercise.
 
  • Like
Reactions: spyfish007
#7
#7
That site's win-confidence methodology is based on this formula: (Stats Won % + FBS Avg Rank % + Win %) x Opponent Win %. Agree that it's a flawed approach to assign each of these stats equal weight, just as it's flawed to claim that passing yards per attempt means zero. But the stats provided are actual, factual numbers that illustrate the overall improvement we've seen this year, which led to our better record and was the whole point of this exercise.
I hope you did not think, I believe passing yards per attempt mean zero! To be clear, I believe pass yards per attempt must be accompanied by the number of attempts. If in one game you threw one pass for 25 yards, all other plays were rushing attempts and/or kicking game, you'd have a 25 yards/attempt (sounds good-real good), it would be a more accurate presentation to say, they only threw once during the entire game, and it was a good pass resulting in a 25 yard gain. I agree we are better-but to assign a 65.17% better, based on this exercise, seems like a stretch. Nonetheless, this are interesting stats, and I'm glad you posted them.
 
Last edited:
  • Like
Reactions: kamoshika
#10
#10
A weaker schedule + defensive improvement = more wins this year. The redzone scoring decline is frustrating after bringing back so much on offense and adding very good players + Cheney.
 
#11
#11
A weaker schedule + defensive improvement = more wins this year. The redzone scoring decline is frustrating after bringing back so much on offense and adding very good players + Cheney.
Clear read-good post. Few (including myself) take the schedule into account soon enough in their initial assessment.
 
#12
#12
Keep in mind that these stats are hurt by the first five games of the year before the team really turned it around. The team RIGHT NOW is much better than the 2018 squad and finished the season on an upswing.
 
#13
#13
Each one of the stats is given the same weight-this is fake math. Yards/Attempt up 6.7%, with out the total number of attempts from both years, it means zero. (completion down 5.5%-), or penalty yards is given the same weight as rushing TDs? I don't see it. To say we are 65% better than last season (as a team) based on this calculation(s), is bogus. We may be 65% better, or 87.3% better, you could manipulate these stats any way you'd like to get the number you'd like. I'll stick with the old fashion, tried and true, W&L record.
I don't believe it's saying we're 65% better, rather they're putting 65% confidence in the fact that we're better.

But going by W/L alone, you'd say we're 40% better in the win column, with a chance to make it 60%.
 
#14
#14
I don't believe it's saying we're 65% better, rather they're putting 65% confidence in the fact that we're better.

But going by W/L alone, you'd say we're 40% better in the win column, with a chance to make it 60%.
I don't believe it's saying we're 65% better, rather they're putting 65% confidence in the fact that we're better.

But going by W/L alone, you'd say we're 40% better in the win column, with a chance to make it 60%.
I'd go a step further, IMHO with 100% confidence we are better than last year. How much better is the question, once again I'd agree that we are in the 40% better range. The real question is how much better or worse is the competition? 40% better -against better teams, is a big improvement. All in all, next season will tell us where we are, no better place to find out how good a team is than playing in the SEC!
 
#15
#15
I don't believe it's saying we're 65% better, rather they're putting 65% confidence in the fact that we're better.

But going by W/L alone, you'd say we're 40% better in the win column, with a chance to make it 60%.
It is not even what you are saying. It is that our stats are 65% better. This exercise is only shedding some light into why we are better this year. Nothing more. I think it also confirms what many already know. We blew too many scoring chances. It was a problem with JG and Maurer. If I remember it correctly, bad performance in the red zone cost us some games.
 

VN Store


Back
Top