Official Global Warming thread (merged)

Thanks for agreeing with me.
He knew the e-mail referred to two different people. We was just abreviating for the audience. That still doesn't make his point any less valid.

He says “And I quote” and then misquotes them. It’s misleading. Read the link about “Mike’s Nature trick” and “hide the decline”. I still don’t see what the fuss is about.

I keep repeating myself. Global temperatures have not changed significantly for the last 17 years while greenhouse gases have surged.

Satellite data and balloon data do not agree with surface temperature data.

Proxy data does not agree with surface temperature data.

Forcing models have been a complete failure.

Specifically, what data set contradicts AGW?
 
more winter storms coming this week -- keep up the good work global warming fakes, maybe we will see 8000 f5 tornados this summer and 8 major hurricanes and throw in some duststorms and wild fires and a mid summer blizzard in the midwest. Avg summer high in the midwest might be 49 degrees
 
  • Like
Reactions: 1 person
4) Your post doesn’t mention which journal it is. If it’s that energy and environment crap you posted earlier, I wouldn’t call it a “leading climate journal”. It’s perfectly normal for scientists and editors to butt heads. This is also covered in the Russell report.

It is odd you would describe a publication of the Royal Society of Chemistry as crap.

Energy and Environment is not a RSC journal.

Energy and Environmental Science is.

The former has an impact factor of 0.3 vs. 11.7 for the latter. While they isn't the best measure of a journal's value, it is certainly the most accessible.
 
Energy and Environment is not a RSC journal.

Energy and Environmental Science is.

The former has an impact factor of 0.3 vs. 11.7 for the latter. While they isn't the best measure of a journal's value, it is certainly the most accessible.

Thanks for the info. The publication is done by credible scientists who present accessible data. I'm sure they would accept yours and anyone else's challenges of their findings.

P.S.-By the way how has the recent weather been up there? Atlanta and Birmingham have been stagnated.
 
Last edited:
He says “And I quote” and then misquotes them. It’s misleading. Read the link about “Mike’s Nature trick” and “hide the decline”. I still don’t see what the fuss is about.


Specifically, what data set contradicts AGW?


Specifically, read the publication Energy and Environment Vol. 22 by Singer et. al. They present plenty of data sets on balloon and satellite data that don't support the surface temperature data. It is a 400 page publication (Singer et. al is 375-405). (It is a critique of Santer's work on AR3). It is done by some guys I tend to trust. It is there for you to shoot down and all the world to see.

Also, the unpublished AR5 will cast doubt due to the unexplained pause or trend reversal or whatever it is. This is what the expert reviewers like Singer and Curry are saying. Muller is one of your guys now who I tend to respect. I will continue to follow his work at Berkley Earth. He believes now that the pause is just a pause. But even if the pause is just a pause, what can we do about it? You going to get the Chinese to sign the Kyoto Treaty? We aren't going to sign it if they aren't.
 
Last edited:
more winter storms coming this week -- keep up the good work global warming fakes, maybe we will see 8000 f5 tornados this summer and 8 major hurricanes and throw in some duststorms and wild fires and a mid summer blizzard in the midwest. Avg summer high in the midwest might be 49 degrees

I do have to agree with these global warming fakes that none of this anecdotal evidence disproves or proves global warming.

P.S.-But that ship of fools down there was pretty funny.
 
Last edited:
When you read the article maybe you can enlighten me about rediosondes. I don't know how to interpret the spectra but if Singer says it doesn't support the surface data then I tend to believe him.
 
The purple line is global temperature. The other lines are forcings. Here it is with details.


:hi:

In geophysics we rarely make direct observations (it’s hard to do that underground…) so it involves primarily proxy data.


Close. Tree rings are hardly the newest proxy data. All proxy data are consistent with measurements and forcing models except a subset of the tree ring data (at high latitudes) which started to diverge in the 60s.

Divergence_Tree_Growth_Temp.gif

Also, this chart specifically demonstrates the tree ring data doesn't support the surface data. I know you're going to say the wood density was falling off. Well, tell me how that makes sense. There is plenty of old growth density in this country and around the world. This to me indicates "selective" data.
 
Last edited:
The biggest problem us skeptics have is you guys have gotten in bed with the liberal politicians to get funding so we don't trust your data. Their "solution" is to grow government like that will fix the problem. Lets pile more laws upon more laws to stop the problem when it is one sided because the rest of the world besides Europe aren't doing jack.
 
Thanks for the info. The publication is done by credible scientists who present accessible data. I'm sure they would accept yours and anyone else's challenges of their findings.

P.S.-By the way how has the recent weather been up there? Atlanta and Birmingham have been stagnated.

Pretty darn cold but reasonable snow. Today is first real snow in a few weeks. Should end up with about a half a foot.
 
Specifically, read the publication Energy and Environment Vol. 22 by Singer et. al. They present plenty of data sets on balloon and satellite data that don't support the surface temperature data. It is a 400 page publication (Singer et. al is 375-405). (It is a critique of Santer's work on AR3). It is done by some guys I tend to trust. It is there for you to shoot down and all the world to see.

Also, the unpublished AR5 will cast doubt due to the unexplained pause or trend reversal or whatever it is. This is what the expert reviewers like Singer and Curry are saying. Muller is one of your guys now who I tend to respect. I will continue to follow his work at Berkley Earth. He believes now that the pause is just a pause. But even if the pause is just a pause, what can we do about it? You going to get the Chinese to sign the Kyoto Treaty? We aren't going to sign it if they aren't.

I checked but like the article on energy and environment says it’s not on the ISI Web of Knowledge so I can’t get an electronic copy. I’ll try to find it at a library because I’m legitimately interested in what it could possibly contain. I don’t mean to dismiss the article based on this, but energy and environment appears to be notorious for having low (if any) peer review standards. And Fred Singer himself is a notorious science denialist – tobacco doesn’t cause cancer, no such thing as acid rain, asbestos is safe, CFC’s & the ozone, etc. – you mention a politicized scientific issue and he’s been on the wrong side of it. Not to mention he was funded by the tobacco and oil industries. Again, I’m not dismissing the work based on this, but Singer has a bad track record.

When you read the article maybe you can enlighten me about rediosondes. I don't know how to interpret the spectra but if Singer says it doesn't support the surface data then I tend to believe him.

Radiosondes are weather balloons. I’ve never flown one so you probably know as much about them as I do. Do they carry spectrometers nowadays? I can give you a crash course in spectrometry if you like.

Also, this chart specifically demonstrates the tree ring data doesn't support the surface data. I know you're going to say the wood density was falling off. Well, tell me how that makes sense. There is plenty of old growth density in this country and around the world. This to me indicates "selective" data.

I find it much more likely that tree ring growths at high northern latitudes have slowed in recent decades than that being the correct data set while thermometers and all other proxies are wrong. Here is a brief overview of tree ring divergence with references to the original works.

The biggest problem us skeptics have is you guys have gotten in bed with the liberal politicians to get funding so we don't trust your data. Their "solution" is to grow government like that will fix the problem. Lets pile more laws upon more laws to stop the problem when it is one sided because the rest of the world besides Europe aren't doing jack.

Maybe if we properly funded science academics wouldn’t go to liberal politicians (and less research would have to be done on industrial grants that restrict open sharing of information :p). I believe in small government but we do need to invest in science and education.
 
  • Like
Reactions: 1 person
I checked but like the article on energy and environment says it’s not on the ISI Web of Knowledge so I can’t get an electronic copy. I’ll try to find it at a library because I’m legitimately interested in what it could possibly contain. I don’t mean to dismiss the article based on this, but energy and environment appears to be notorious for having low (if any) peer review standards. And Fred Singer himself is a notorious science denialist – tobacco doesn’t cause cancer, no such thing as acid rain, asbestos is safe, CFC’s & the ozone, etc. – you mention a politicized scientific issue and he’s been on the wrong side of it. Not to mention he was funded by the tobacco and oil industries. Again, I’m not dismissing the work based on this, but Singer has a bad track record.

He tends to be a skeptic no doubt. But, so do I. I haven't seen him discuss the effects of tobacco but I tend to be a skeptic about most environmental issues that tend to be hyped.


Radiosondes are weather balloons. I’ve never flown one so you probably know as much about them as I do. Do they carry spectrometers nowadays? I can give you a crash course in spectrometry if you like.

I understand normal spectrometry with conventional x-y axis but the radiosonde graph is something I haven't seen. (They plotted some of these data sets on the graph I posted below.)


I find it much more likely that tree ring growths at high northern latitudes have slowed in recent decades than that being the correct data set while thermometers and all other proxies are wrong. Here is a brief overview of tree ring divergence with references to the original works.


Maybe if we properly funded science academics wouldn’t go to liberal politicians (and less research would have to be done on industrial grants that restrict open sharing of information :p). I believe in small government but we do need to invest in science and education.

That's a different debate. Maybe if government incentivized corporations to invest more with the stipulation that the investments don't restrict open sharing. I like a capitalistic approach. I don't know how much open sharing funding Google or Apple do.
 
Last edited:
Thank you Santa for sending some Global Warming to Cincy. It has been above freezing the last few days, the humidity is coming up (fewer bloody boogers in the morning), the snow is melting, and it is actually bearable to go outside for more than 10 minutes.

Signed,

Not so cold in Cincy.
 
of balloon and satellite data but it is pulled from an earlier referenced work from Spencer and Christy.
 

Attachments

  • 2013_11_03_singer_chart1.png
    2013_11_03_singer_chart1.png
    522.3 KB · Views: 9
Last edited:
However, I do agree with you that the surface temperature record did show an increase to about 1997.
 
It is highly unlikely that industry funds much of any external research unless it can file IP prior to publication and owns those rights.

I don't know what you are considering open vs closed, but that seems to be the reality outside of something like google who is throwing money at AIDS research or something like that.

Government incentives wouldn't sway this a large degree for the companies that actively manage their programs as there is a significant internal investment on top of what is being paid to the university.

There are also agenda-driven purposes to fund research - some bad some good - and in those instances the IP is sometimes less important than the collaboration or buzz.
 
  • Like
Reactions: 2 people
Thank you Santa for sending some Global Warming to Cincy. It has been above freezing the last few days, the humidity is coming up (fewer bloody boogers in the morning), the snow is melting, and it is actually bearable to go outside for more than 10 minutes.

Signed,

Not so cold in Cincy.

Right now I could say the same thing for Jackson. With a wind chill it's 16 degrees now at 5:30 pm. It's been 23 all day.
 
He tends to be a skeptic no doubt. But, so do I. I haven't seen him discuss the effects of tobacco but I tend to be a skeptic about most environmental issues that tend to be hyped.

I understand normal spectrometry with conventional x-y axis but the radiosonde graph is something I haven't seen. (They plotted some of these data sets on the graph I posted below.)

That's a different debate. Maybe if government incentivized corporations to invest more with the stipulation that the investments don't restrict open sharing. I like a capitalistic approach. I don't know how much open sharing funding Google or Apple do.

It’s OK to be skeptical, but there is a fine line between skeptic and denialist. Scientists are skeptics – most were very skeptical of AGW when it was first suggested (just like any paradigm-shifting discovery), but as the evidence accumulated more and more embraced it as fact. Singer is not a skeptic – he’s a denialist. Even worse he appears to be a denialist-for-hire. If I were you I’d look into his history and reconsider trusting him as a scientific authority.

I actually located a copy of Singer’s paper (here). Having read it and some background it appears that his central claim is that there is a statistically significant difference between the UAH satellite dataset and climate models in the tropical lower troposphere. This is essentially the same song and dance that Spencer and Christy (who derived and maintain the UAH dataset) have been performing since 1990. Granted back then there was a significant difference between their data and the models, but since then several errors have been discovered in their analysis (by themselves and others) and several revisions have been made that have brought their trend closer to what is predicted by the models.

UAHcorrections.jpg


There are more suggestions still that may improve the agreement between UAH and the models, such as including the forcings of the two major eruptions in the satellite era (El Chicon and Pinatubo) and correcting for the stratospheric cooling bias. Today it’s still true that UAH shows a slightly lower than expected tropospheric temperature trend in the tropics (UAH currently shows 0.14 C/decade, while models indicate it should be about 0.2 C/decade). Whether this is statistically significant and calls into question our understanding of atmospheric physics and confidence in our ability to successfully model future climate is essentially the point of contention. Santer et al. found that the difference is not statistically significant – here is his paper which Singer attempts to rebut. I don’t have the data or knowledge of statistics to evaluate their claims, but I’ll take Santer’s word for it over Singer considering Singer’s history, the history of corrections to the UAH dataset, and the fact that it’s the outlier. UAH is only one of several groups analyzing satellite data, and they only find a discrepancy between observed and modelled warming trends only in the lower troposphere only at the tropics.

of balloon and satellite data but it is pulled from an earlier referenced work from Spencer and Christy.

These aren’t spectra and I don’t see it in the Singer paper. Is this the figure you meant to post?

However, I do agree with you that the surface temperature record did show an increase to about 1997.

That’s such a typical example of cherrypicking. I’m just going to leave this again.
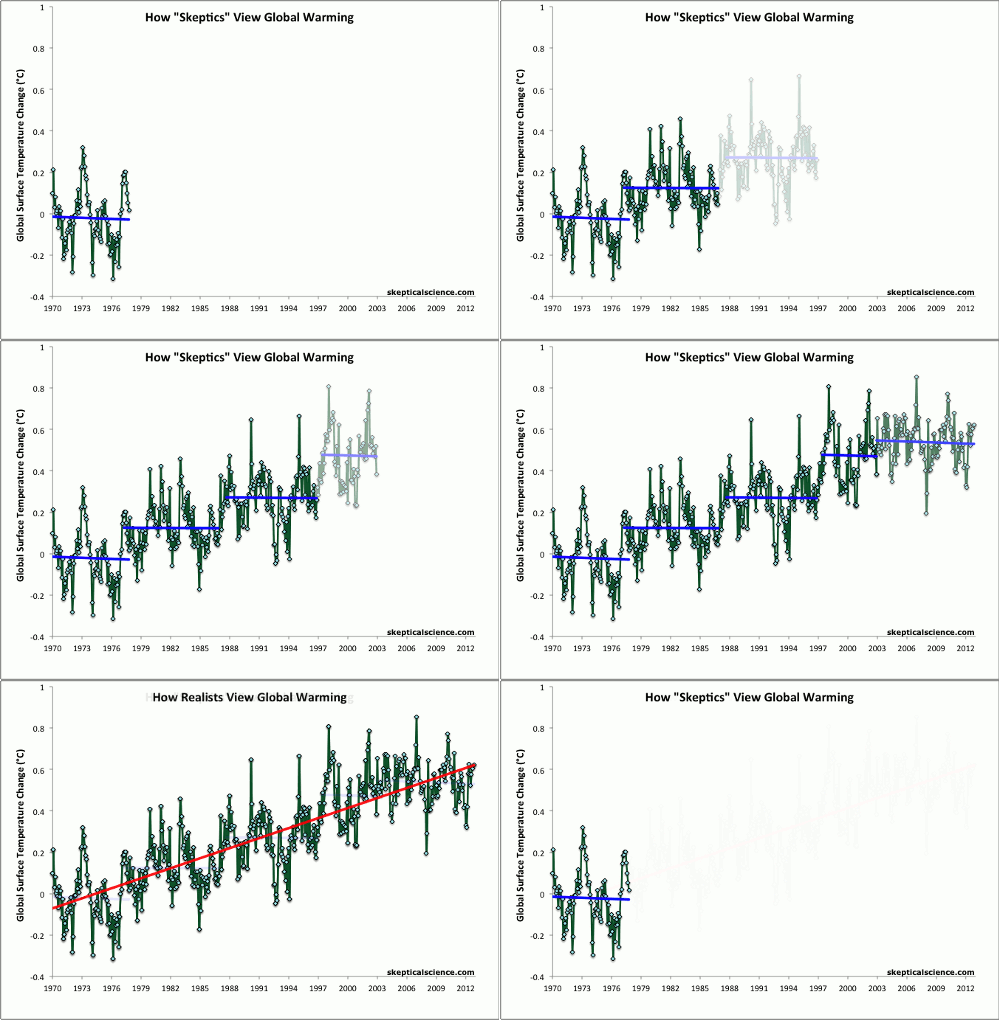
Escalator_2012_500.gif
 
Advertisement


Back
Top