Official Global Warming thread (merged)

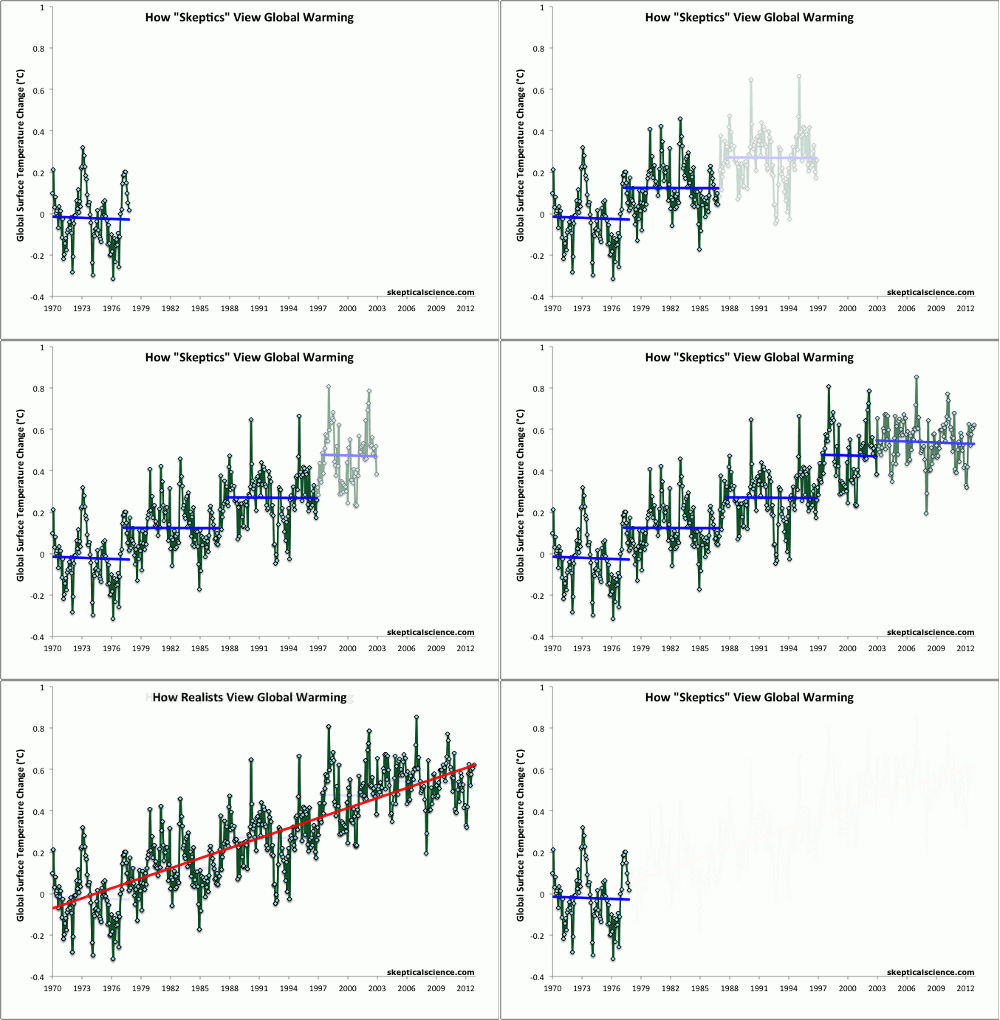
Temperatures fluctuate over short periods, but this lack of new warming is a surprise. Ed Hawkins, of the University of Reading, in Britain, points out, "That surface temperatures since 2005 are already at the low end of the range of projections derived from 20 climate models. If they remain flat, they will fall outside the models’ range within a few years."
 
Hey, are you related to Mann?

Yeah I’m his grandpa. Actually no. I just understand and respect science.

Temperatures fluctuate over short periods, but this lack of new warming is a surprise. Ed Hawkins, of the University of Reading, in Britain, points out, "That surface temperatures since 2005 are already at the low end of the range of projections derived from 20 climate models. If they remain flat, they will fall outside the models’ range within a few years."

Some literature you yourself posted concluded we should expect, on average, two decades every century with a flat warming trend. Sure it’s a surprise when it happens, but it doesn’t cast doubt on our understanding of AGW. Get back to me in 20 years if the trend hasn’t picked up again.

The guide on the state of climate change science recently published by the US and UK national science academies is worth a look.

"Decades of slow warming as well as decades of accelerated warming occur naturally in the climate system. Decades that are cold or warm compared to the long-term trend are seen in the observations of the past 150 years and also captured by climate models. Because the atmosphere stores very little heat, surface temperatures can be rapidly affected by heat uptake elsewhere in the climate system and by changes in external influences on climate (such as particles formed from material lofted high into the atmosphere from volcanic eruptions). More than 90% of the heat added to Earth is absorbed by the oceans and penetrates only slowly into deep water. A faster rate of heat penetration into the deeper ocean will slow the warming seen at the surface and in the atmosphere, but by itself will not change the long-term warming that will occur from a given amount of CO2. For example, recent studies show that some heat comes out of the ocean into the atmosphere during warm El Niño events, and more heat penetrates to ocean depths in cold La Niñas. Such changes occur repeatedly over timescales of decades and longer. An example is the major El Niño event in 1997–98 when the globally averaged air temperature soared to the highest level in the 20th century as the ocean lost heat to the atmosphere, mainly by evaporation.

Recent studies have also pointed to a number of other small cooling influences over the past decade or so. These include a relatively quiet period of solar activity and a measured increase in the amount of aerosols (reflective particles) in the atmosphere due to the cumulative effects of a succession of small volcanic eruptions. The combination of these factors, both the interaction between the ocean and the atmosphere and the forcing from the Sun and aerosols, is thought likely to be responsible for the recent slowdown in surface warming.

Despite the decadal slowdown in the rise of average surface temperature, a longer-term warming trend is still evident (see Figure 4). Each of the last three decades was warmer than any other decade since widespread thermometer measurements were introduced in the 1850s. Record heatwaves have occurred in Australia (January 2013), USA (July 2012), in Russia (summer 2010), and in Europe (summer 2003). The continuing effects of the warming climate are also seen in the increasing trends in ocean heat content and sea level, as well as in the continued melting of Arctic sea ice, glaciers and the Greenland ice sheet."
 
Yeah I’m his grandpa. Actually no. I just understand and respect science.


Some literature you yourself posted concluded we should expect, on average, two decades every century with a flat warming trend. Sure it’s a surprise when it happens, but it doesn’t cast doubt on our understanding of AGW. Get back to me in 20 years if the trend hasn’t picked up again.

The guide on the state of climate change science recently published by the US and UK national science academies is worth a look.

"Decades of slow warming as well as decades of accelerated warming occur naturally in the climate system. Decades that are cold or warm compared to the long-term trend are seen in the observations of the past 150 years and also captured by climate models. Because the atmosphere stores very little heat, surface temperatures can be rapidly affected by heat uptake elsewhere in the climate system and by changes in external influences on climate (such as particles formed from material lofted high into the atmosphere from volcanic eruptions). More than 90% of the heat added to Earth is absorbed by the oceans and penetrates only slowly into deep water. A faster rate of heat penetration into the deeper ocean will slow the warming seen at the surface and in the atmosphere, but by itself will not change the long-term warming that will occur from a given amount of CO2. For example, recent studies show that some heat comes out of the ocean into the atmosphere during warm El Niño events, and more heat penetrates to ocean depths in cold La Niñas. Such changes occur repeatedly over timescales of decades and longer. An example is the major El Niño event in 1997–98 when the globally averaged air temperature soared to the highest level in the 20th century as the ocean lost heat to the atmosphere, mainly by evaporation.

Recent studies have also pointed to a number of other small cooling influences over the past decade or so. These include a relatively quiet period of solar activity and a measured increase in the amount of aerosols (reflective particles) in the atmosphere due to the cumulative effects of a succession of small volcanic eruptions. The combination of these factors, both the interaction between the ocean and the atmosphere and the forcing from the Sun and aerosols, is thought likely to be responsible for the recent slowdown in surface warming.

Despite the decadal slowdown in the rise of average surface temperature, a longer-term warming trend is still evident (see Figure 4). Each of the last three decades was warmer than any other decade since widespread thermometer measurements were introduced in the 1850s. Record heatwaves have occurred in Australia (January 2013), USA (July 2012), in Russia (summer 2010), and in Europe (summer 2003). The continuing effects of the warming climate are also seen in the increasing trends in ocean heat content and sea level, as well as in the continued melting of Arctic sea ice, glaciers and the Greenland ice sheet."

That is a myopic viewpoint and not science based but politically based.
 
That is a myopic viewpoint and not science based but politically based.

It was jointly published by the US National Academy of Sciences and the Royal Society of London and reviewed by (among others) leaders in the field of climate science. Some reviewers even criticized it for being too conservative since it doesn't point out changes that models are underestimating such as the rapid decline in arctic sea ice.

It's in layman's terms because it's meant to inform the public. Doesn't mean it's not scientific. AR5 will tell you the same thing, with references.

Doubt as you please but once the warming trend picks back up, don't go crying "global warming stopped in 2024" in 2028. 'Skeptics' have made that claim over a dozen times hand picking different dates. Either they're being purposefully misleading or they suffer long-term memory loss

AR5 and this junk from NCS are political-based propaganda and not science. So because some misinformed critic's think it should be more alarming because they're not including the rapid decline in polar bear population then that makes it conservative? Not. Maybe we should send that ship of fools to investigate the Artic sea ice. It's amazing how all your credibility is tied to the decline of the planet.
 
Last edited:
mean and this is considered a rapid decline?
 

Attachments

  • artic sea ice.png
    artic sea ice.png
    57.1 KB · Views: 1
Last edited:
2d960dcc7c7317cfcff9190f2a999e26cc749c6e888599d34ebde98013335d3b.jpg


SeaIceDecline_591.gif


2013_Arctic_Escalator_500.gif


Escalator_2012_500.gif
 
  • Like
Reactions: 2 people
Talk about cherry picking. You'd think with all that money the IPCC could construct an accurate model.
images

You're clearly the one cherrypicking. Here's the rest of those figures:

seaice.pl


seaice.pl


seaice.pl


seaice.pl


seaice.pl


seaice.pl


seaice.pl


seaice.pl


seaice.pl


seaice.pl


seaice.pl


We care about the september ice extent because that's when the yearly minimum ice extent occurs.

"The summer melt season usually begins in March and ends sometime during September. The sea ice minimum has been occurring later in recent years because of a longer melting season. However, ice growth and melt are local processes; sea ice in some areas will have already started growing before the date of the sea ice minimum, and ice in other areas will still shrink even after the date of the minimum.

Changes in the timing of the sea ice minimum extent are especially important because more of the sun's energy reaches Earth's surface during the Arctic summer than during the Arctic winter. As explained above, sea ice reflects much of the sun's radiation back into space, whereas dark, ice-free ocean water absorbs more of the sun's energy. So, reduced sea ice during the sunnier summer months has a big impact on the Arctic's overall energy balance."

-NSIDC

Yeah that's when you bark the loudest. It looks like it is snapping back nicely. September this year must have been the start of a trend change. Too bad their satellite has gone out.
 
  • Like
Reactions: 1 person
And again.

Figure is misleading for the previously listed reasons.

For one thing, the y-axis is a 12 month differential so you inherently can’t tell long term trends from that figure. What it does pick up on is brief CO2 spikes following El Nino years (maxima in the SST – red in your figure), which is a well known phenomenon (though the authors of that paper apparently weren't aware). Also the implicit assumption that global average temperature should follow miniscule changes in the yearly rate of CO2 increase is silly.

CO2 has been rising since the mid 18th century but T didn’t take off until the 20th century. Again, isotopic data confirms that it’s not ‘natural’ CO2. Smoking gun

Here it is without doing the differential:

hss2012fig1-12-FALSEFALSEFALSE.png


What part of this figure makes you think CO2 is following temperature?
 
Figure is misleading for the previously listed reasons.


Here it is without doing the differential:

hss2012fig1-12-FALSEFALSEFALSE.png


What part of this figure makes you think CO2 is following temperature?

This one does though don't you think?
 

Attachments

  • CO2 lags.jpg
    CO2 lags.jpg
    105.9 KB · Views: 1
Yeah that's when you bark the loudest. It looks like it is snapping back nicely. September this year must have been the start of a trend change. Too bad their satellite has gone out.
wtf.jpg


One year =/= trend. What are you not getting about this?
 
Figure is misleading for the previously listed reasons.


Here it is without doing the differential:

hss2012fig1-12-FALSEFALSEFALSE.png


What part of this figure makes you think CO2 is following temperature?

You mean comparing two numbers not on the same scale? That's why they did the differential.
 
Nice figure.

This one does though don't you think?

It captures the fact that CO2 is a feedback of temperature increase - warm El Nino years cause a slight short-term increase in atmospheric CO2. But it doesn't mean that the CO2 increase in our atmosphere is due to a natural temperature increase. If CO2 tracked temperature as closely as your figure is implying you could lay the CO2 and temperature curves on top of eachother. Clearly, it doesn't:

800px-CO2-Temp.png


And again, the isotope data is the smoking gun that the CO2 rise in our atmosphere is due to burning fossil fuels and not a feedback from a naturally warming climate.
 
No just realizing you're what's wrong with climate science. You're obviously a poster child for climate science. Which one are you?

Out of counterarguments and resorting to personal attacks? Ok. If I have to pick one I'll go with Bill Nye.

You might be right about what's wrong with climate science (or science in general really) - public perception. I, like many, don't have patience for stupidity so when you make one dumb comment after another I'm going to poke fun, even though it's ultimately counterproductive. I can't resist :) you're on a roll today

That's the pot calling the kettle black.
 
  • Like
Reactions: 1 person
That's the pot calling the kettle black.

The difference between us is I explained the science (multiple times) before ragging on you. You fail to point out any flaws in what I've said and instead proceed to ad homs. That sounds like an admission of defeat :p

But seriously, what do you still not get?
 
The difference between us is I explained the science (multiple times) before ragging on you. You fail to point out any flaws in what I've said and instead proceed to ad homs. That sounds like an admission of defeat :p

But seriously, what do you still not get?

What was the temperature in the Savannah area, or as close to the area, on March 3, 719000BC? I'm going to compare it to how tomorrow plays out. If you can grab me the mean global temperature that day it would be great as well. Thanks.

Also, what do you propose we do about our current climate situation?
 
Advertisement


Back
Top